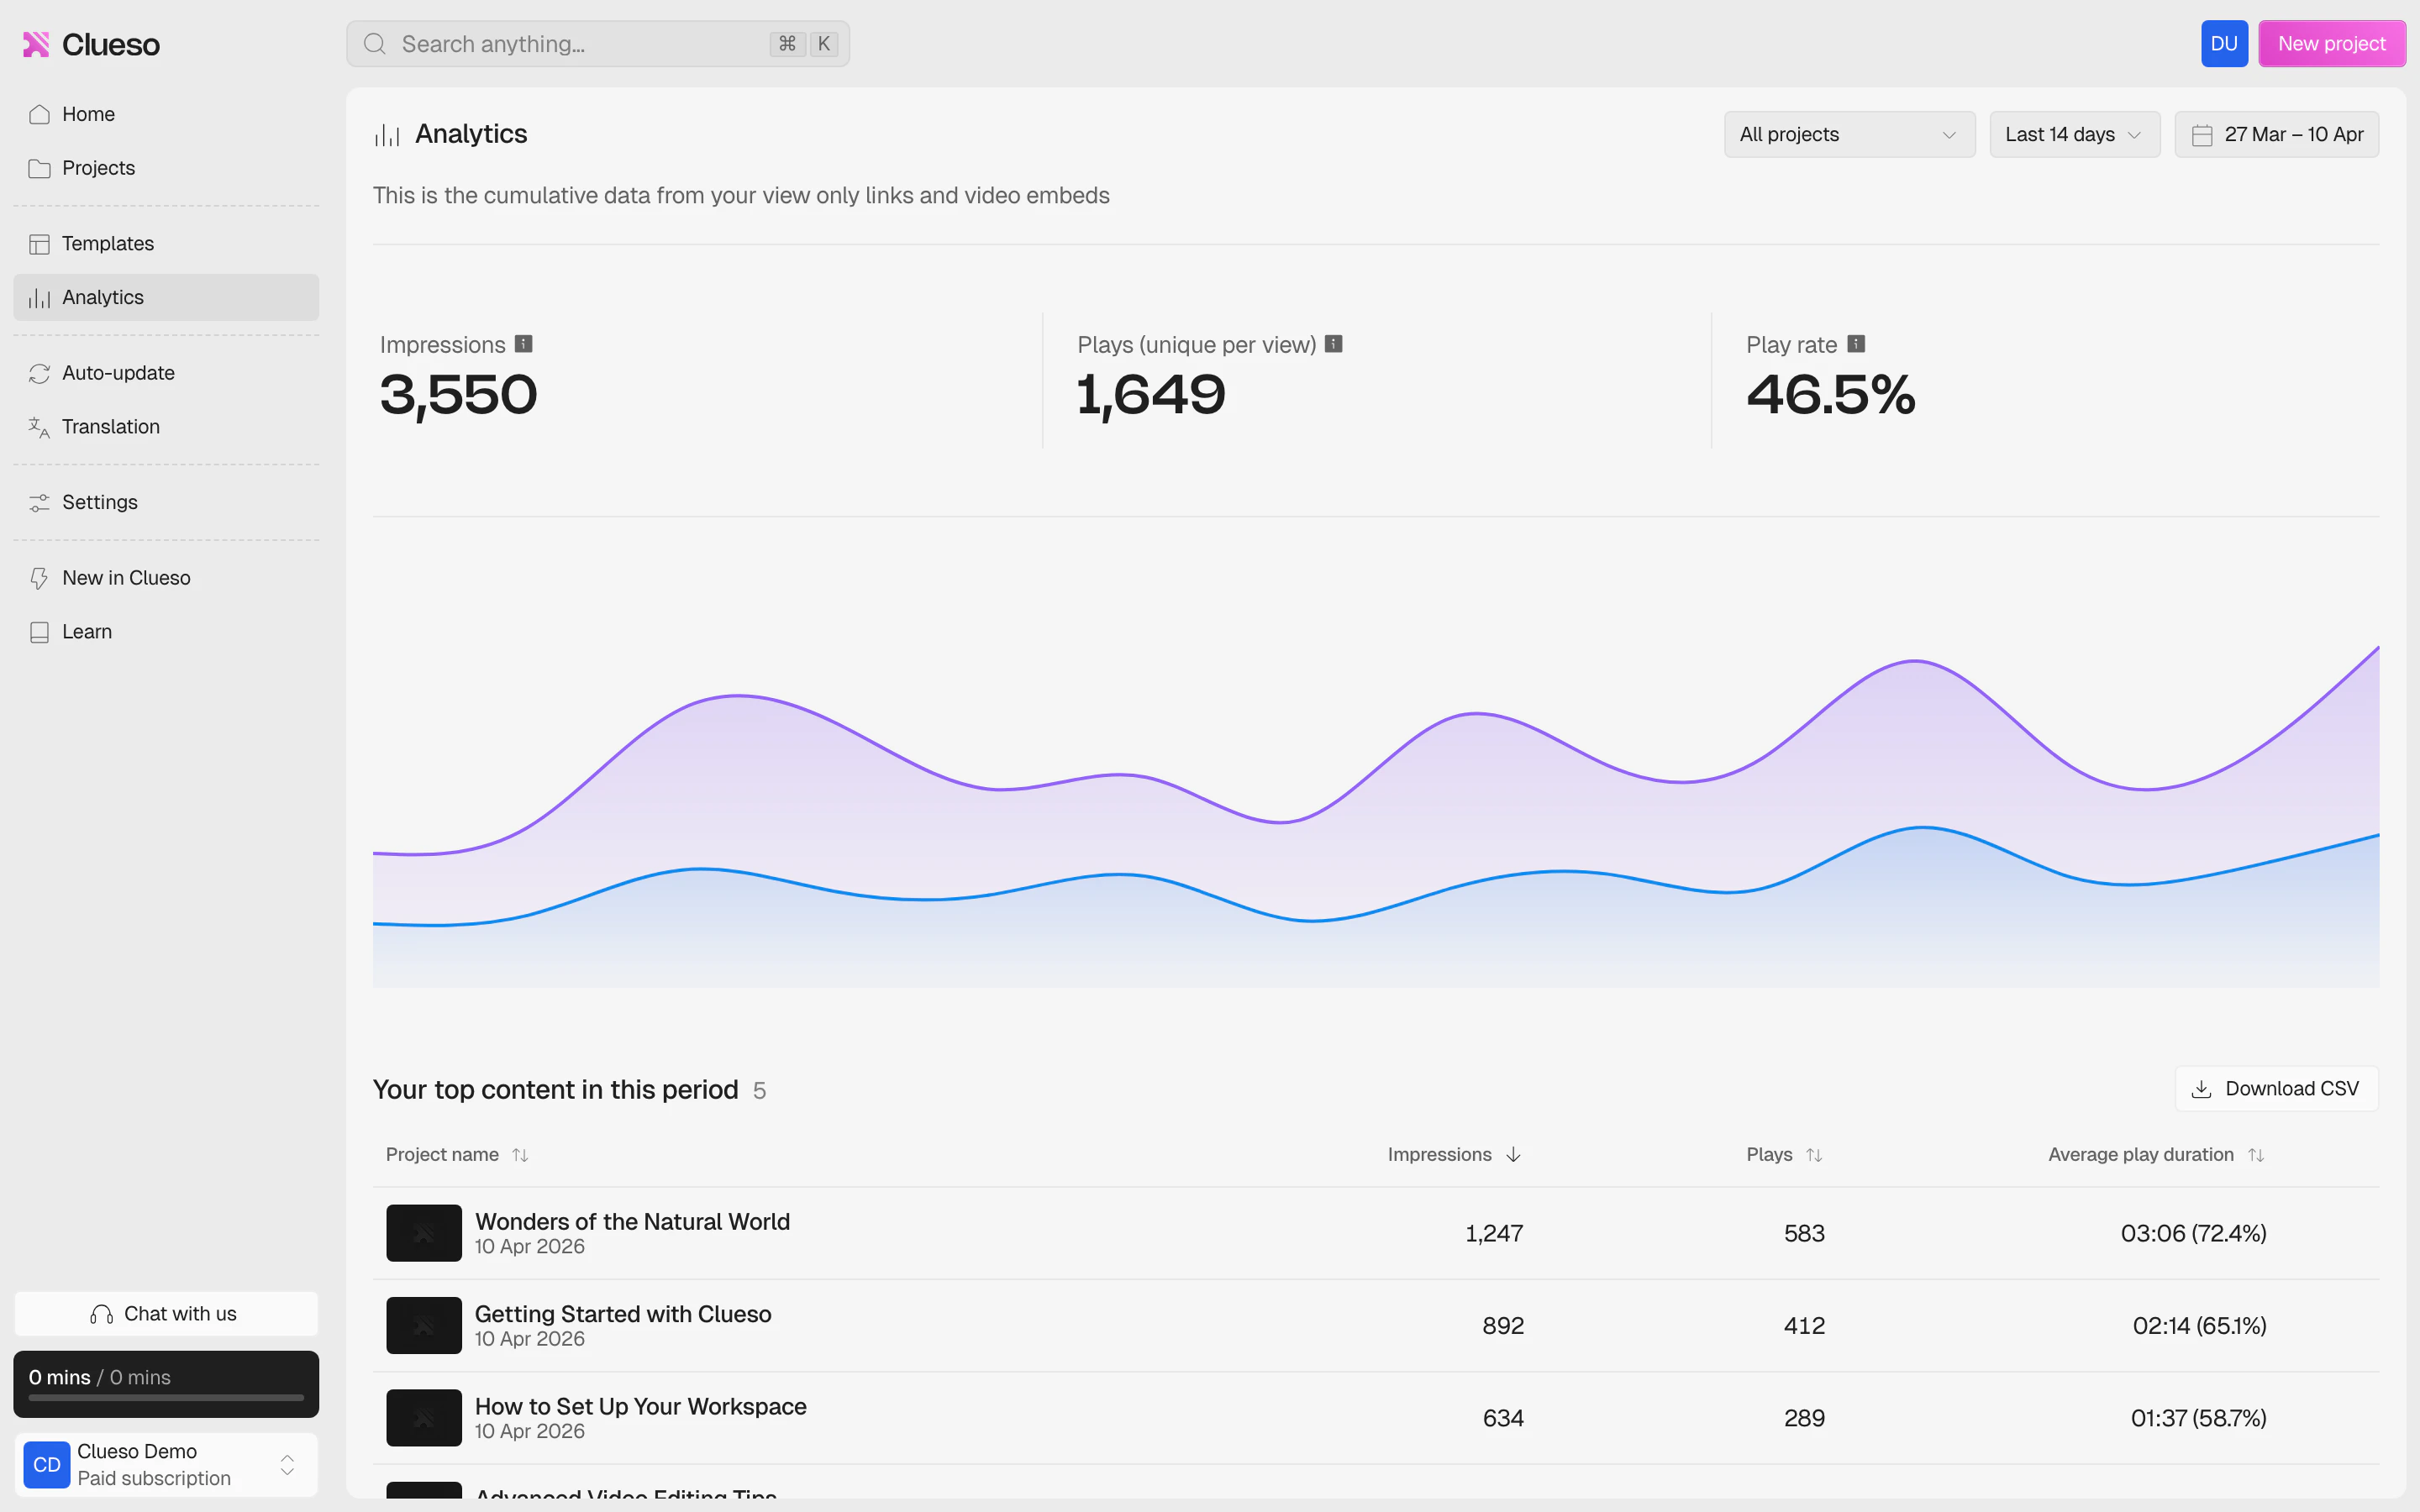
Overview metrics
At the top of the page, you’ll see three key metrics for the selected time period:- Impressions — the number of times your content was opened, regardless of whether the video was watched.
- Plays — the number of unique video plays per viewing session. Rewatches in the same session are not counted.
- Play rate — the percentage of impressions that resulted in a video play.
Filtering your data
Use the filters at the top of the page to narrow down your analytics:- Project filter — select a specific project or view data across all projects.
- Date range — choose from preset ranges (Last 7 days, Last 14 days, Last 30 days, Last 90 days) or set a custom date range.
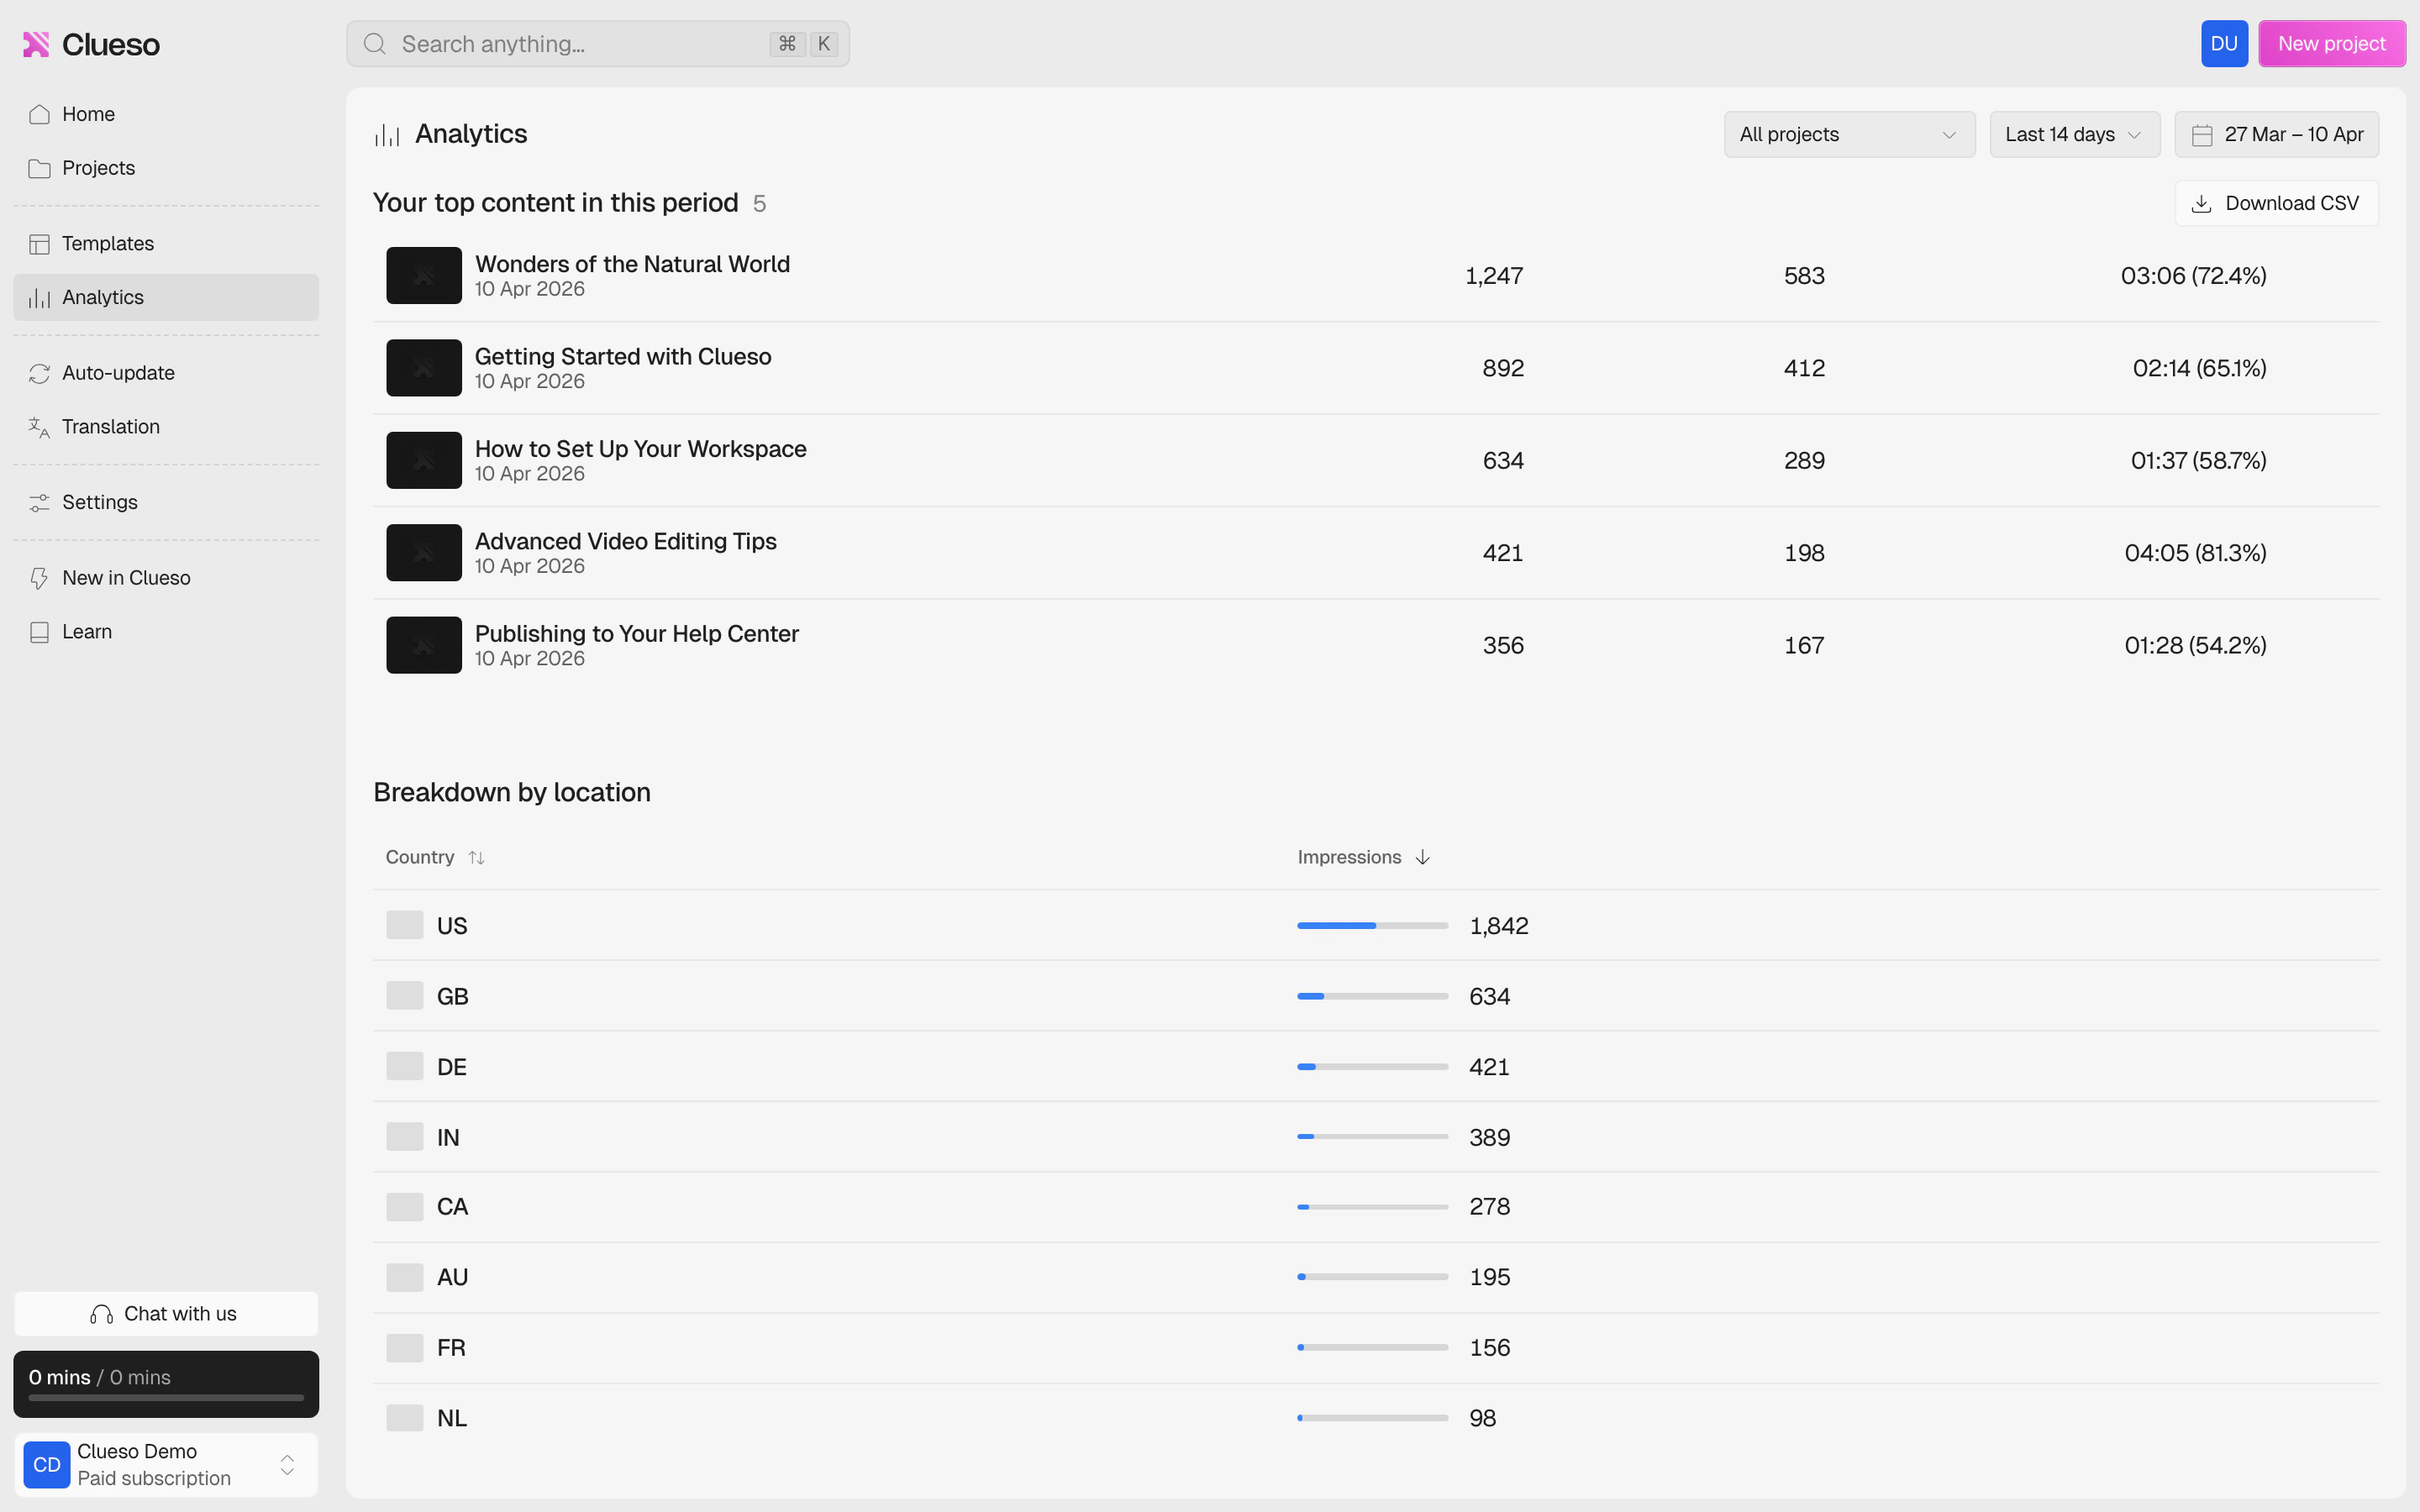
Your top content
The Your top content in this period table ranks your projects by performance. For each project, you can see:
Click any column header to sort the table. You can also Download CSV to export this data for further analysis.
Audience retention
When you filter to a specific project, an audience retention section appears. This shows:- Average watch duration — how long viewers watched on average, and what percentage of the video that represents.
- Retention curve — a chart showing the percentage of viewers still watching at each point in the video.
- Drop-off indicator — pinpoints the exact moment where the average viewer stopped watching.
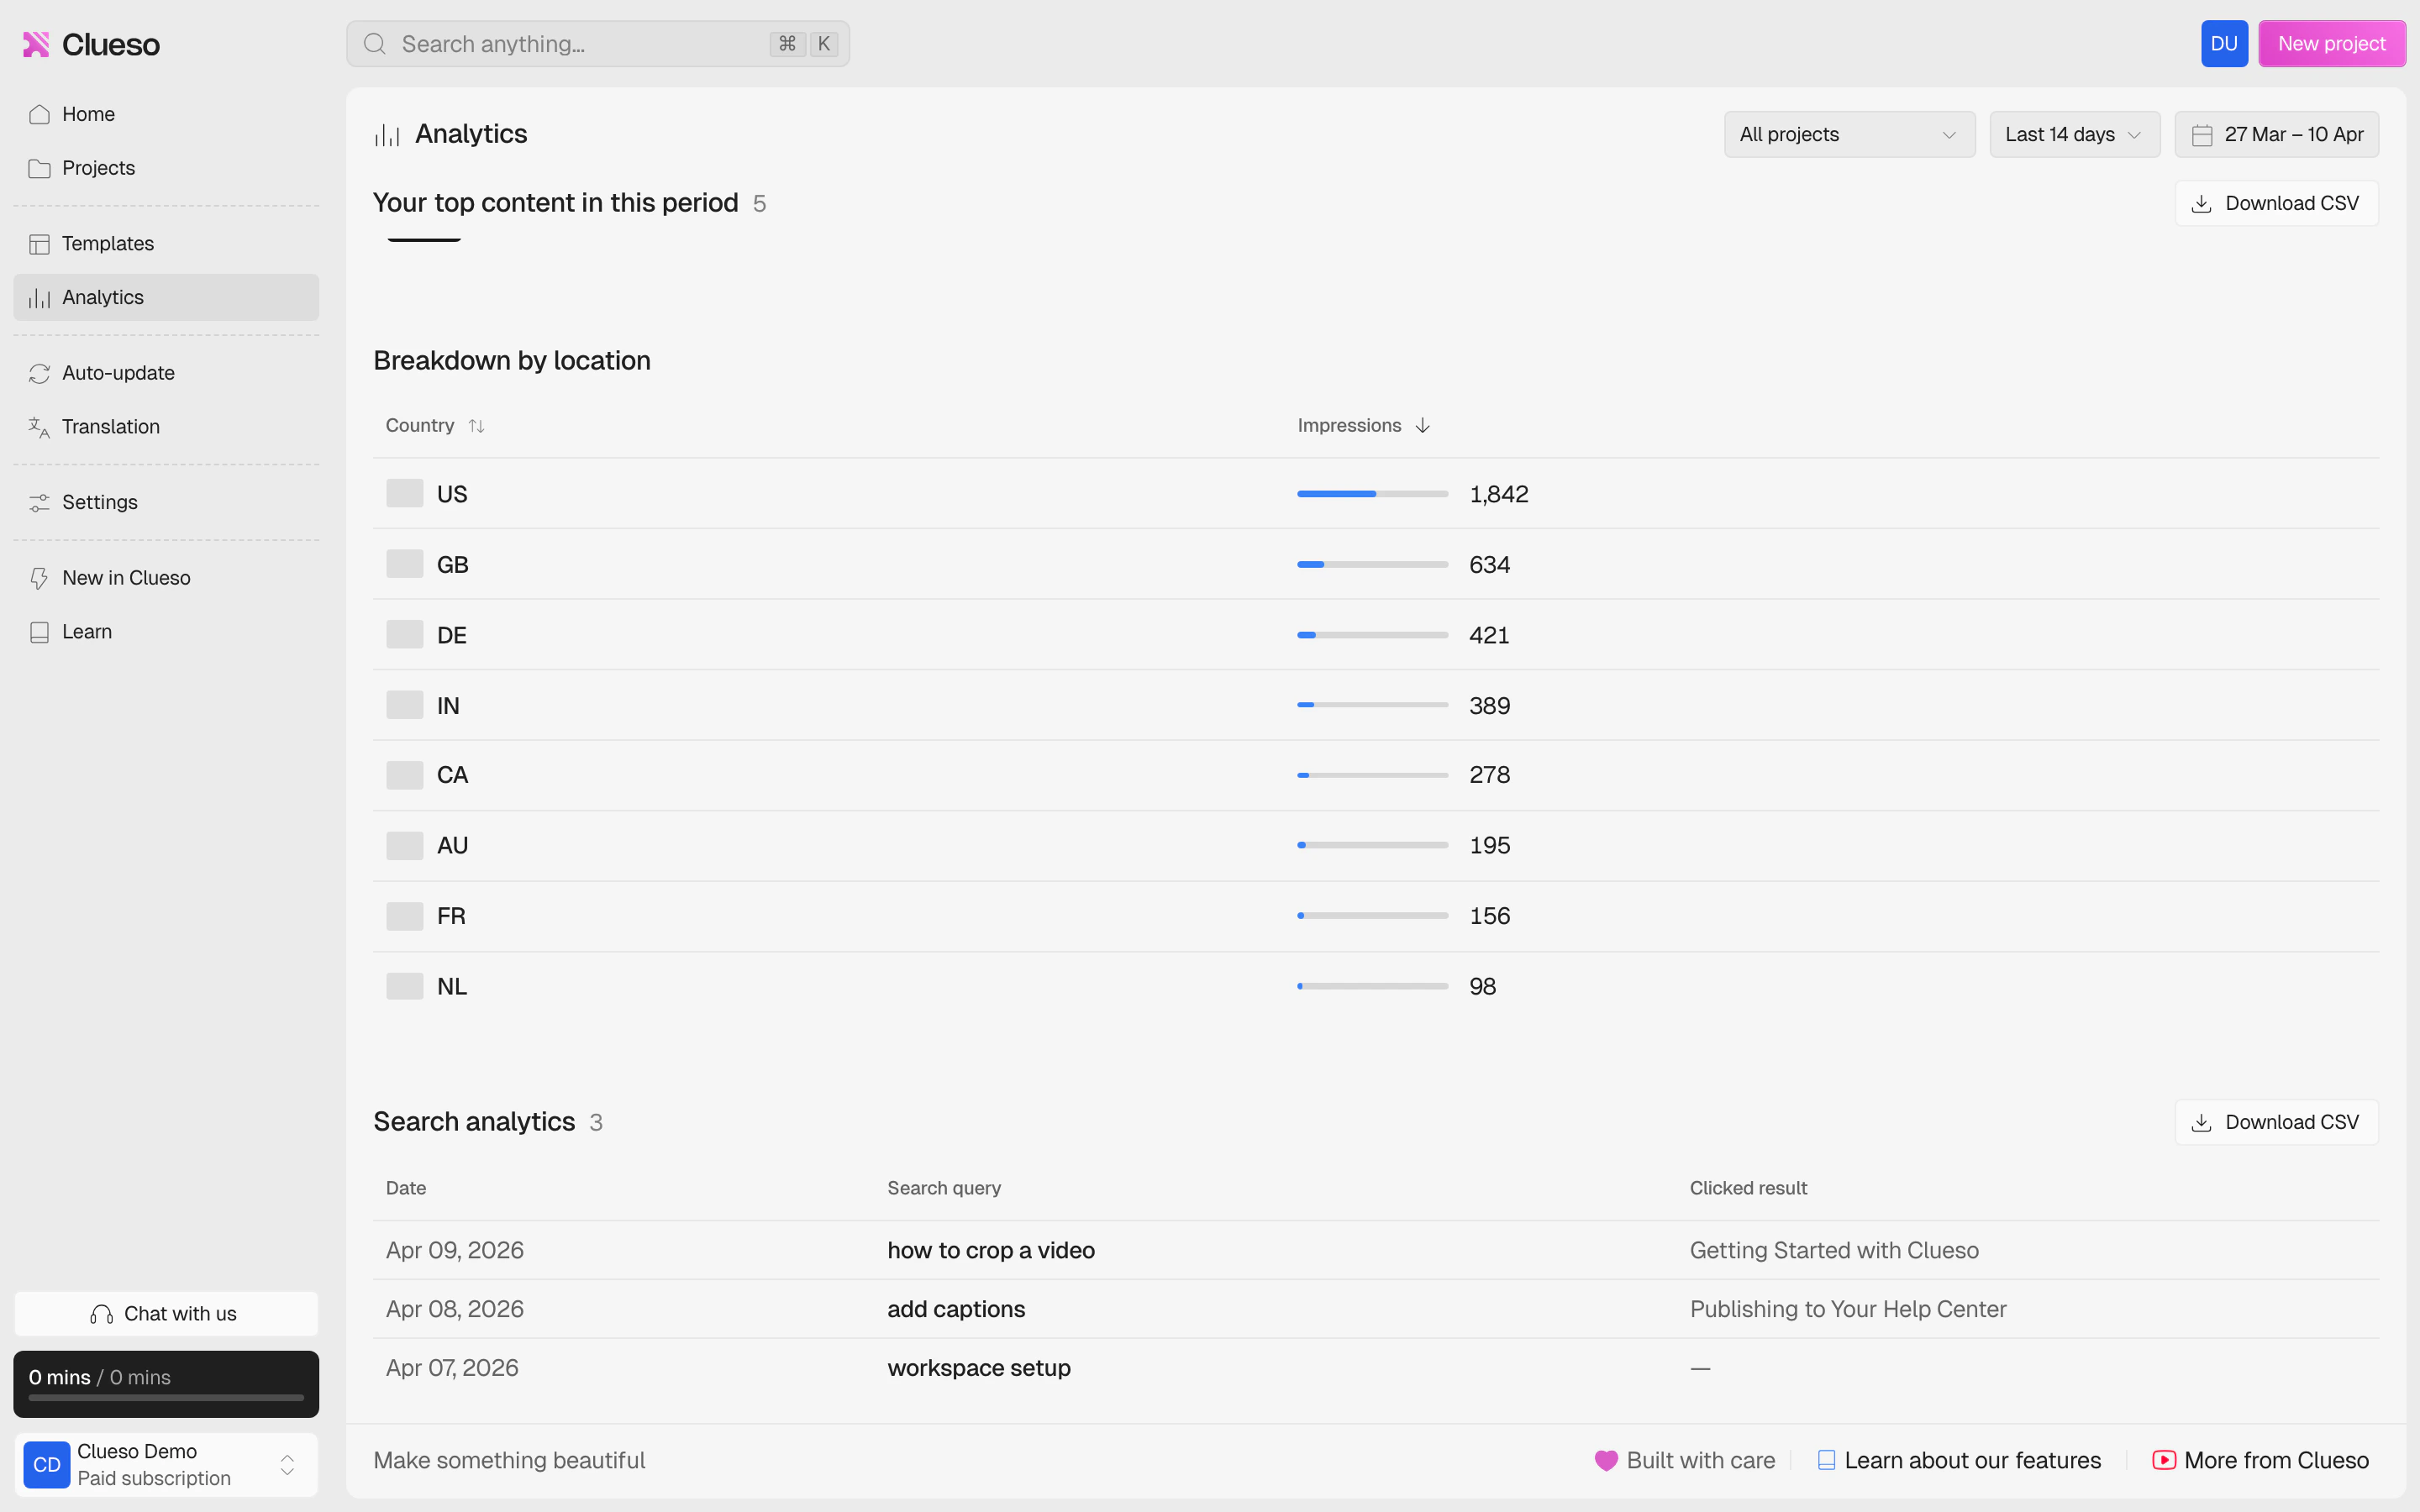
Breakdown by location
The Breakdown by location table shows where your viewers are located. Each country is listed with its total impression count and a visual bar showing its share relative to the others. Click the column headers to sort by country name or impression count.Search analytics
The Search analytics table shows what your audience is searching for in your help center. For each search, you can see: